Asteroid "46053 Davidpatterson" Light Curve

Bruce L. Gary & Dave Healy
2005.10.04

Abstract
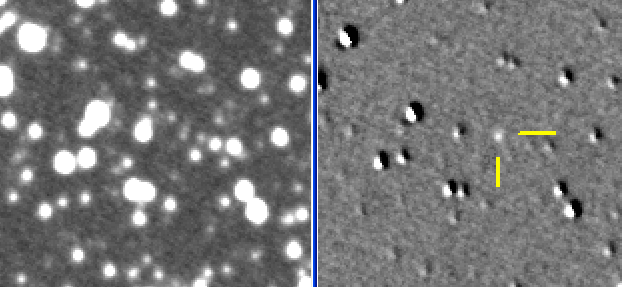
This web page describes the determination of a light curve for a faint asteroid. It is not unusual for professionals to establish light curves for main belt asteroids having opposition magnitudes of ~20 to 21; however, the observations and analysis described here were performed by amateurs. Special data analysis procedures were devised to reduce the effects of background field stars. The principal value of this web page is a description of these data analysis techniques.
Links Internal to this Web Page

   
Introduction
    Observations on 2005.09.01

    Analysis Procedure
    Results for 2005.09.01
    Observations on 2005.09.26
    Combining Data for Both Dates
    Photometric Calibration

Introduction

This observing project is meant to show that amateurs are capable of measuring the light curve of asteroids as faint as magnitude ~20.

Of course, not every amateur has a high-quality 32-inch Ritchey Chretien telescope system like the one used for these observations. We use the Junk Bond Observatory's Optical Guidance System 32-inch telescope and fork-mount (owned and operated by author DH). It is housed in a computer-controlled 16.5-foot dome. The CCD camera is a SBIG model STL-6303E. It is a large format CCD (27.7 x 18.5 mm main chip) that employs a KAF-6303E main chip having a 3072 x 2048 pixel layout (9 micron square pixels size) and a TC-237 autoguider chip (not used for these observations). All components are computer-controlled except the focusing, which is reliably constant due to the telescope's low-to-zero expansion invar cage.

Observations on 2005.09.01

Observations were made with 2x focal reducer lens to increase the field of view (FOV), which was ~27 x 18 'arc. Unfiltered exposures of 120-second duration were made during a 2.7-hour observing period on the evening of 2005 August 31 (2005.09.01 UT). Autoguiding was not used since the OGS mount has excellent tracking. All CCD camera control and image analysis was performed using MaxIm DL (ver. 4.0). Binning was set to 2x2, which provided 3.5 pixels per FWHM during the best seeing for the observing session. Eleven flat field images were made near sunset and were median combined using automatic level normalization. The CCD temperature of -8 C was maintained during most of the observations. A set of 10 1-minute dark frames were median combined to produce a master dark frame. Dark frame calibration used the "auto-optimize" feature to compensate for the difference in exposure time and small differences in CCD temperature. An observing sequence was used to automatically expose and record images. The limiting magnitude for a 2-minute, unfiltered image is Cv = 21.3 when the seeing is FWHM = 4.0 "arc (where Cv represents the V-magnitude equivalent using a "clear" filter).

A total of 66 exposures were made of the asteroid field during a 2.7-hour observing period. Following this about 35 minutes was spent performing photometry calibration observations of a star field near M27 for which Arne Henden had recently produced a BVRI photometric sequence for 20 stars.

The following is a typical example of a 2-minute exposure that has been flat field and dark frame calibrated.

FOV full

Figure 1. Example of a single 2-minute exposure. FOV = 26.6 x 17.7 'arc, northeast at upper-left, reduced in apparent size to fit this web page. The asteroid location is at the intersection of the two line segments (not visible here).  

Zoom FOV

Figure 2. Two-times zoom of the center of the above image. The asteroid is barely visible, and has SNR ~7. FOV = 13.3 x 8.9 'arc.

The asteroid's SNR is insufficient for use in aligning since low SNR objects have centroid locations that are influenced by random noise for each pixel. The following section describes how the low SNR situation was overcome for the purpose of creating alight curve.

Analysis Procedure

The asteroid's motion was 0.12 "arc/minute (northward). The image scale was 1.04 "arc/pixel (where a pixel is a 2x2 binned pixel). During the course of exposing and downloading 4 images the asteroid moved 1.1 "arc, or 1.0 pixel. The FWHM for stars was typically 4.4 "arc after median combining 4 images, so the enlargement of the asteroid's FWHM in a 4-image median combine image was very small (4.5 versus 4.4 "arc). The following image is a median combine, using stars for alignment, of 4 calibrated 2-minute images.

4-image MC

Figure 3. Crop and zoom of a 4-image median combine, showing the asteroid having SNR ~14.

1st & last images

Figure 4. Median combine of 4 images each for the beginning (left) and end (right) of the 2.7-hour observing period. The asteroid is located within the yellow circles. The blue cirlces show where the assteroid was located at the other end of the observing period. The asteroid's motion is mostly northward (upward) along a path 34 "arc long.

Notice the presence of faint background stars near the asteroid's track. The reason the asteroid appears especially bright at the end of the observing session (upper position) is because the asteroid is very close to background stars (with Cv ~ 21). The problem of background stars is worst near the middle and end of the observing period. Background stars is often the most important problem to solve when attempting light curves for faint asteroids.

One method used to correct for the influence of background stars on an asteroid's apparent brightness in an image involves the use of an image taken when the asteroid was at a different location. For example, consider images taken at the beginning and end of the observing session. Start by assuming that the first image can be used to locate the asteroid's RA/Dec location. The aperture circles can be placed at the sameRA/Dec location in the last image to obtain a flux that is produced by the background stars. If there are no background stars then the flux reading will be close to zero (and dominated by CCD thermal pixel noise and sky background noise). If there's a background star within the signal aperture it will produce a positive signal, and this will have to be subtracted from the flux reading of the asteroid when it was at the same loaction. If there's a background star within the sky reference annulus it will produce a negative flux, and that will have to be used to add to the asteroid flux reading. One limitation of this technique is that it is difficult to accurately establish the asteroid's track. This is due to the influence that background stars have upon the centroid pixel location of the asteroid. The fainter the asteroid, the worse is this problem.

An alternative method for removing the effect of background stars is to subtract one image from another, after careful alignment using the stars, and proceed to measure the asteroid flux. This method was adopted for the present analysis. When an image is subtracted from another the resultant image will in theory register nothing where stars are present but register the complete brightness distribution of the moving asteroid. In a real-world situation the stars will not exactly cancel since they will have a slightly different point spread function (due to seeing changes) in different images and they will have a slightly different intensity due to atmospheric extinction changes (caused by air mass differences). Nevertheless, the intensity of the star field can be reduced by a coule orders of magnitude. The brightness of faint stars in the subtracted image along the asteroid's track will also be reduced in amplitude by a couple orders of magnitude. This, in effect, should remove the effect of a field of faint background stars in an objective manner and allow for an accurate measurement of the asteroid's flux.

Subtracting images increases the noise level at each pixel location. It is therefore important to use a "reference" image, defined as an image where the asteroid is "out of the way," that has a longer total exposure than the signal image. By averaging several images when the asteroid is "out of the way" to produce a reference image the subtracted image will have only a small amount of additional noise. In the case of this 2.7-hour observing session the asteroid didn't move much, just 34 "arc. Care was taken in producing reference images for each of several time intervals of the asteroid's motion. The following figure shows the before and after subtraction for an image near the end of the observing session, when the asteroid was located among several background stars.

Subtraction example

Figure 5. Demonstration of "removal" of background stars without affecting the asteroid's presence in the subtracted image (cross intersection).

In this image the bright stars were not completely subtracted because of an imperfect pixel alignment (~1/2 pixel error, which is sometimes unavoidable) and different star intensities and PSFs (point-spread functions). Nevertheless, the asteroid is clearly evident (using an objective image analysis procedure) and it is clear of nearby background star artifacts - which permits the aperture signal circle and sky reference annulus to be used in a straightforward (free of subjective user decisions) manner, as the next figure illustrates.

Aperture cicles on subtracted image

Figure 6. Same as right panel of previous image, with aperture circle pattern centered on the asteroid for making a flux "reading."  The asteroid flux has SNR = 22 for this set of eight 2-minute images (and corresponds to Cv = 19.71).

Using the the above image as a guide (asteroid's SNR = 22, Cv = 19.71) it should be possible to detect asteroids with Cv in the range of 21.9 (SNR = 3) to 23.1 (SNR = 1), even in crowded star fields.

A set of these images were used to measure the flux of the asteroid for sets of eight 2-minute images. These asteroid fluxes were converted to Cv magnitudes using telescope photometry coefficients derived on the same night and described in a later section. The plot of Cv versus time is shown in the next section.

Results for 2005.09.01 Observations

The following graph shows the light curve for the asteroid during the 2.7-hour observing period of 2005.09.01 UT.

Light curve for 2005.09.01

Figure 7. Light curve for the first night of observations.  (The faint gray symbols are from an alternative analysis method.) The error bars are stochastic SE and do not include systemtic uncertainties.

This Minor Planet Center lists this asteroid's H value as 16.2. According to the ephemeris it should have had a V-magnitude of 19.65 at the time of these observations. Instead, it is 0.40 magnitude fainter, implying that H = 16.60.

The asteroid's average diameter is estimated to be 1740 meters (range 1230 to 3900 meters). These diameters are based on it brightness and an albedo assumption of 15 % (range 3 to 30%). For an asteroid this size the most likely rotation period is 5.3 hours (range 4.8 to 6.0 hours, SE). The measured value of 4.6 hours is near the short end of the expected range.

The brightness peak-to-peak variation of 0.90 magnitude (twice the "amplitude") is slightly larger than for asteroids of this size.

Asteroid light curves are often non-sinusoidal. It is possible that the extra brightness of the first point is real. After all, at ~3 UT and 5.3 UT we are viewing opposite sides of the asteroid (the largest solid angle perspective of the "potato" shaped obsject). The end-on view at ~4.0 UT can have a different brightness from the other end-on view that we would have had at ~6.5 UT. More observations are needed to clarify the shape of this asteroid's light curve.

Here's an animation of the asteroid's motion.

Animation
Figure 8. Animation of asteroid motion during the 2.7-hour observing period.


Observations of 2005.09.26


The second observing session was 25 days later when the asteroid was predicted to be 0.47 magnitude fainter than during the first observing session (20.12 versus 19.65).  Given that the previous observations called for an H-value
fainter by 0.4 magnitude the ephemeris value of 20.12 meant that we should expect that the asteroid would actually average ~20.5.

Here's an example of image subtraction for a set of 4 images.

Before image subtraction

Figure 9. Before image subtraction. Note the barely visible asteroid at the center of the photometry aperture circles. The stars to the upper-right of the asteroid have V-magnitudes of 16.2.

After image subtraction

Figure 10. After image subtraction. In this image the asteroid is easily visible.

LC for 2005.09.26

Figure 11. Light curve for 2005.09.26. Each green diamond is based on 4 images, each having an exposure of 2-minutes. The red diamonds are based on 8 images.
The error bars are stochastic SE and do not include estimated uncertainties.

The average brightness of 20.4 is close to what was expected based on the 2005.09.01 observations. The amplitude is also the same as 25 days earlier, corresponding to a 0.90 magnitude peak-to-peak variation. The period is also approximately the same.

It is noteworthy that the photometric calibration for the second observing session was quite different from the first one. The next section describes how a set of stars near M27 were used to establish the JBO telescope photometry constants. For the second session another telescope was used to establish magnitudes for stars near the asteroid's location on 2005.09.26. A 14-inch Celestron was used on 2005.09.29 to observe a set of 14 stars in the Skiff catalog with B and V magnitudes. The star region was 1/4 degree to the east of the 2005.09.26 asteroid location, which made it unecessary to refine the zenith extinction value for transferring Skiff brightnesses to the stars near the asteroid field. The 14-inch Celestron's telescope system photometry constants had values similar to those on previous occasions when Landolt regions were observed, and the 14 Skiff stars exhibited a 0.018 magnitude RMS scatter about the color-correcting solution.

Combining Data From Both Dates

A rotational light curve solution must satisfy the night's light curve for both observing dates, as illustrated in the following figure.

Both dates LC

Figure 12. Light curve for 2005.09.01 (red) and 2005.09.26 (blue), with a 236 period offset for the latter. The model trace is a sinusoid with parameter values given in the figure. The model also includes ephemeris values for average magnitude for the two dates but including an offset of +0.4 for 2005.09.01 and +0.2 for 2005.09.26.
The error bars are stochastic SE and do not include systemtic uncertainties.

Since the two observing dates were 25 days apart, during which the asteroid rotated ~236 times, it is not possible to unambiguously solve for a period. Periods of 2.5261 or 2.5477 are equally acceptable. Indeed, the period solution should be stated as P = 5.05232 + N * 0.01075 where N = any integer between -5 and +5. To resolve the period it would be necessary to observe on two closely separated nights.

The standard brightness in the ephemeris is off by about 0.3 magnitude, and should be 16.5 (instead of 16.2). There is a slight difference between the H values required for 2005.09.01 (H = 16.6) and 2005.09.26 (H = 16.4). This could be due to errors in either of the observing session's all-sky photometric calibration (completley different photometric calibration procedures were used for the two observing sessions), or maybe it is due to the changed observing geometry (i.e., G differs from the assumed value 0.15).

I should comment about the SE error bars and their apparent Bayesian incompatibility with the model fit. It is extremely unlikely that the error bars are correct since there are many data points that depart from the model by several SEs. The plotted SE bars are stochastic, based solely upon SNR - specifically, SE = 1/SNR. Systematic uncertainties are undoubtedly present but they are very difficult to impossible to evaluate prior to comparing the data to a reasonable model. There are two cattegories of systematic SE: those that are shared by all data, such as a photometric calibration error, and those that casn change during the observing session. This latter category is obviously present as evidenced by the large differences between points that are spaced closer in time than any light curve variation could accomodate; the first category is probably present but it can't be proven from anything evident in this data set. The "varying systematic error" must be approximately 0.15 magnitude since this amount of error would have to be orthogonally added to the stochastic SE in order for the total SE to be compatib le with the above model. This 0.15 varying systmatic error, or ~15%, could easily be produced by an incomplete star field subtraction. Typically, the star field subtraction ios only 99% effective, leaving a residual ~1% feature in the subtracted image. If a nearby star is 100 times brighter than the asteroid then the residual feature would have the same amplitude as the asteroid. This residual star feature could be within the signal aperture or in the sky background annulus. In one case the apparent asteroid brightness would be increased, while in the other case it would be decreased. The amplitude of the increases would be larger than the amplitude of the decreases, but there should be fewer increases than decreases since the pixel area for the signal aperture is smaller than that for the sky background annulus. Another predicted behavior for these residual background features is that they should become important as the asteroid becomes less bright. At some faint level the signature of residual background stars should become the dominant component for all measurements. The level where this happens will depend upon how many background stars there are. These observations were made at a galactic latitude of -18 degrees and a longitude close to galactic center. Therefore the star density was greater than for a typical region of the sky. Presumably, it should be possible to observe asteroids fainter than this one (CV= 20.4) for determining light curves provided they are at greater galactic latitudes.


Photometric Calibration of JBO 32-inch Telescope System

M27

Figure 13. M27 with a square showing where Arne Henden's photometric sequence stars are located. FOV = 26 x 17 'arc. RGBC exposure times are 6, 6, 6 and 10 minutes.

Crop & zoom of M27

Figure 14. Crop and zoom of above image 27 showing a blue nova (cross hairs) and 8 bright reference stars used to calibrate the JBO 32-inch telescope system.

Eight of the calibrated stars in the above image were used to establish the following JBO 32-inch telescope system photometric constants:

    Cv = 23.30 -2.5 * LOG (S / g ) - 0.15 m + 0.86 * C

where Cv = V-magnitude equivalent using a "clear" filter,
          S = star flux using a large aperture [data number counts],
          g = exposure time [seconds],
          m = air mass,
          C = star color, defined as either 0.57 * (B - V) - 0.30 or (V-R -0.31), whichever is most convenient.

 Note that star flux S can be calculated using a small aperture provided it is adjusted for the flux ratio corresponding to small and large signal apertures (using a bright star with no nearby background stars). A small signal aperture is always better to use with faint objects in order to maximize SNR. For the asteroid observations I used two small signal aperture radii, 5 and 6 pixels, and a large aperture radius of ~12 pixels, which led to a flux ratio correction f5 =0.85 and f6 = 0.91.

__________________________________________________________  

First created: 2005.09.03   Last updated: 2005.10.04